
ENDA
Analytics for publishers

See what your readers search for, click and book

Your Kompare dashboard shows the whole journey, from a reader seeing your widget to a confirmed booking. See which widgets work, what your audience searches for and what it earns you.

Join the waitlist as a publisher →

Kompare is in closed beta. No spam, we only reach out about early access.

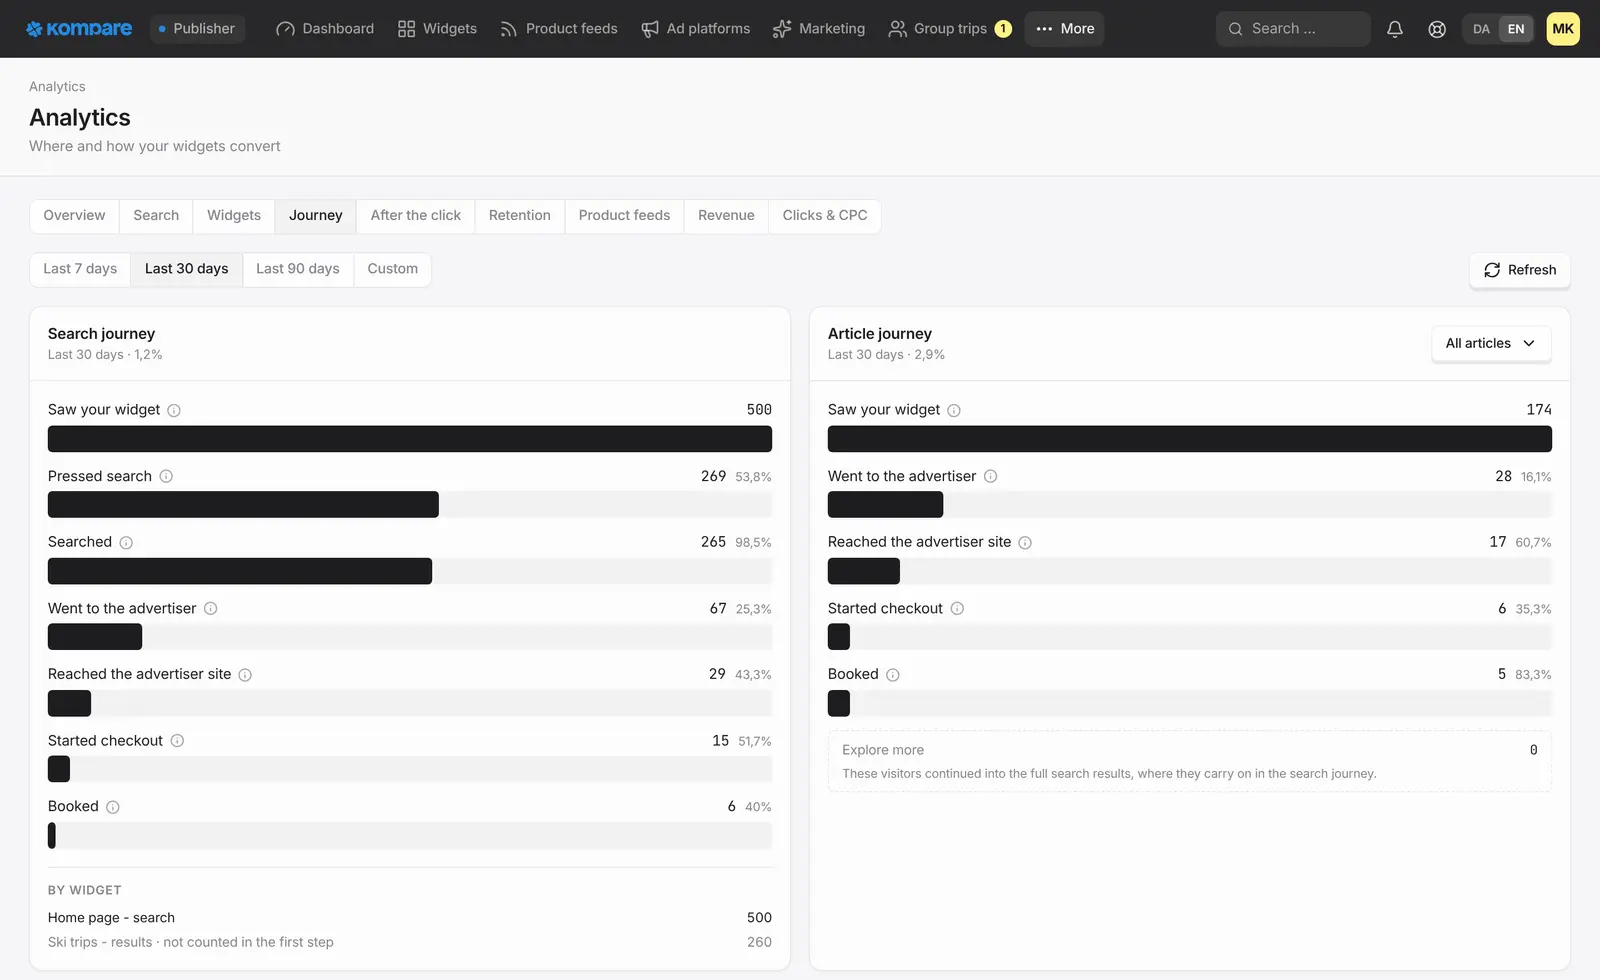
The Journey tab in publisher analytics: the search journey and the article journey as funnels from seeing the widget to booking, with counts and conversion between steps.
Example with made-up data.

The whole funnel

Follow readers from seeing your widget, to searching, to clicking a trip and on to the travel agency. Where the agency has Kompare tracking, you see checkout and booking too.

Earnings at a glance

Page views, visitors, click-outs, conversions, your commission and your click earnings, over 7, 30 or 90 days or a range you choose.

Compare your widgets

See loads, click-outs, conversions and potential booking value for each widget, so you know which placement works.

What your audience searches for

The most searched destinations, the filter combinations readers use most, performance by niche and where your traffic comes from.

Returning readers

See how many readers come back, grouped by when they first visited.

The questions readers ask the AI

If you use AI search, read the conversations and see what readers asked and what they did next.

From first view to booking

The funnel shows where readers drop off and where they move on. It has seven steps.

The last three steps come from the travel agency's own site, so they show up only for agencies with Kompare tracking installed. A table shows which agencies are covered, so you can tell a gap in the data from a lack of interest.

  • Saw your widget
  • Pressed search
  • Searched
  • Went to the travel agency
  • Reached the agency's site
  • Started booking
  • Booked

Learn what your audience wants

Beyond the funnel, the dashboard shows what your readers look for. Use it to decide which destinations to write about and where to place your widgets.

If you have switched on AI search for a widget, you can read your readers' conversations with it, newest first. Filter for the ones that were refused, failed, found no trips, led to a click or led nowhere. They show which questions your audience asks that your widget cannot answer yet.

  • Search volume per day and the most searched destinations
  • The filter combinations readers use most, and how many trips match them on average
  • Performance by niche and by traffic source
  • Returning readers, grouped by when they first visited
  • Paid clicks, every click-out followed into the travel agency's booking flow, and your product feeds, each in its own view
  • If you use the AI Article widget, a separate journey with page views per article
  • In each widget's settings, a table of travel agencies with clicks, sales, commission and what you earn per click and per sale
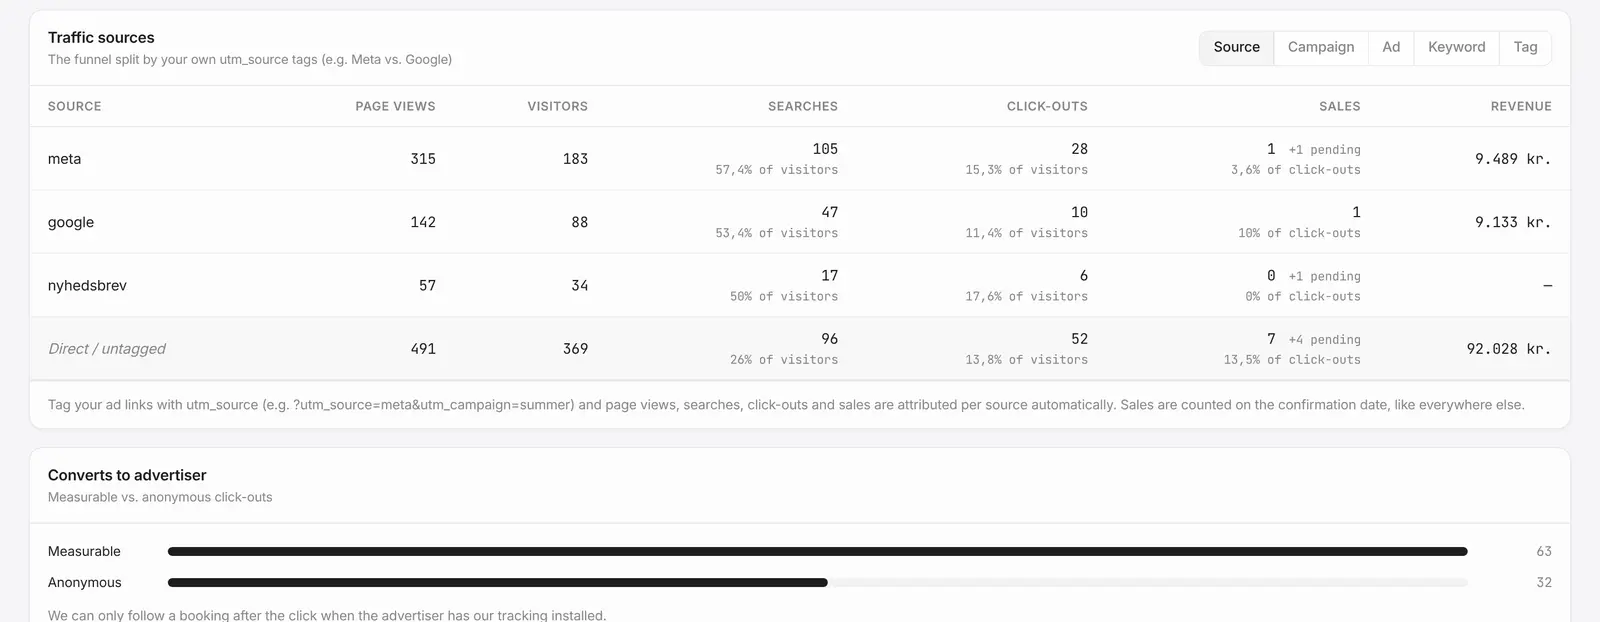
A traffic sources table splitting page views, visitors, searches, click-outs, sales and revenue by source, such as Meta, Google and a newsletter.
Example with made-up data.

What the numbers mean

A few definitions, so you read the dashboard the way it is built. Days follow Danish time.

The dashboard is not real-time. Figures are cached for up to an hour. You can refresh the statistics at any time and the dashboard once an hour.

  • A page view counts once, even if the page holds several widgets
  • A click-out is a reader sent on to a travel agency
  • Conversion rate is approved sales divided by click-outs
  • Revenue counts approved sales only. The funnel's last step also shows bookings that are still pending or disputed
  • Click-outs are counted on Kompare's servers, so ad blockers cannot hide them

How it works

  1. Join the waitlist

    Tell us about your site and your audience.

  2. Place your widgets

    As readers start to search, your dashboard fills with their journey.

  3. Follow the funnel

    Pick 7, 30 or 90 days or a custom range, and compare your widgets.

Frequently asked questions

Is the data real-time?

No. Figures are cached for up to an hour. You can refresh the statistics at any time and the dashboard once an hour. The dashboard is built to show trends, not to watch single visits happen.

Will I see every booking?

You see bookings from travel agencies that have Kompare tracking installed, and the dashboard shows which agencies those are. For an agency that tracks sales with another system, the funnel stops when the reader leaves for the agency.

What is the difference between a page view and a click-out?

A page view is a visit to a page with your widgets, counted once even if the page holds several. A click-out is a reader being sent on from your site to a travel agency.

Can I read what readers ask the AI?

Yes, if you have switched on AI search for a widget. You see the conversations from your own readers, newest first, and what the reader did afterwards.

Related

Be first when we open up

Tell us about your business and we will reach out personally when we open up access.

Join the waitlist as a publisher →

Updated 5 November 2026